Street Art by Alec/Pacific Coast Highway and Sunset Blvd.
Modeling Economic Inequality under Democratic and Republican Administrations: Trends and Consequences
(Author’s note: this document has become somewhat historic, as the model, now named the Cambiant model, has been significantly more developed thanks to a small, but very useful grant. The name is from the Latin ‘cambiare’, meaning to exchange and trade, and ‘camber’, as in airfoil properties)
Several of my friends, noting my avocational immersion (some say obsession) with economic modeling, have asked me to please explain what I am up to in plain English. I had mentioned that a lot of statistics appear to show the truth but not the cause of the old adage that if you want to live like a Republican, you should vote Democratic. Thus, the question has become, “Can your model show why this is so?” While the model is still in embryonic form, here’s some background and an explanation. (For more information on how the model works, see notes at end of article)
Larry Bartels, Director of the Center for the Study of Democratic Politics at Princeton University, quotes Treasury Secretary Henry Paulson’s 2006 statement; “…as our economy grows, market forces work to provide the greatest rewards to those with the needed skills in the growth areas. … This trend … is simply an economic reality, and it is neither fair nor useful to blame any political party.”
Bartels takes exception to the claims of increasing wealth inequality as caused by natural forces, and in his book, Unequal Democracy, states the following: “ The tendency to think of economic outcomes as natural and inevitable is politically significant because it discourages systematic critical scrutiny of their causes and consequences… My aim in this chapter is to refute the notion that the causes of economic inequality in contemporary America “have little tie to government.” Indeed, I suggest that the narrowly economic focus of most previous studies of inequality has caused them to miss what may be the most important single influence on the changing U.S. income distribution over the past half century– the contrasting policy choices of Democratic and Republican presidents.”
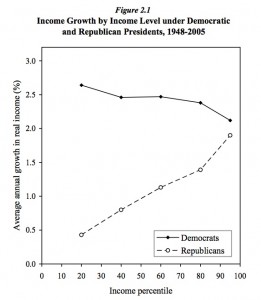
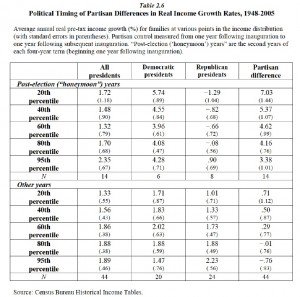
Economist Paul Krugman in his April 2008 NY Times blog commented on Bartels: Now, I’m a big Bartels fan; I’ve known about this result for quite a while. But I’ve never written it up. Why? Because I can’t figure out a plausible mechanism. Even though I believe that politics has a big effect on income distribution, this is just too strong — and too immediate — for me to see how it can be done. Sure, Republicans want an oligarchic society — but how can they do that?. He also reproduced the following graph from Bartel’s book, neatly documenting the economic growth in real dollars for low and high income levels during more than fifty years of Republican and Democratic presidents. (click on images for larger version)
http://www.wcfia.harvard.edu/sites/default/files/BartelsND.pdf
Note that the average growth rate of the lowest 20% was less than .5% under the Republican administrations, while under Democrats, it was over 2.5%, or 5 times greater. At the same time, Bartel’s graph shows us that the growth of the highest 10% was again higher under the Democrats; slightly over 2% vs. slightly under 2% by the Republicans.
My “Camber Line” (CL) model (see notes) is capable of projecting future wealth distribution by establishing a growth coefficient for a given economic structure. Thus one can look at the impact of various growth coefficient changes over time.
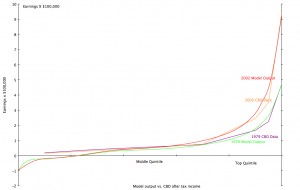
The model was used to produce wealth distribution for 1979, then projected forward to 2002 by simply changing the growth coefficient in the model from 6.3 to 9.6. The result produces a near doubling of the income of the top 1% while low to moderate income levels stagnate or decline. As can be seen in Fig 2, the CL model results closely match the actual Congressional Budget Office graph of post-tax income. The CL model also shows a significant percentage of the population is underemployed as the growth coefficient is increased. We can observe that increase in employment results from a lower growth coefficient by observing the far left of the income distribution curves. ( See attached notes for comments on model accuracy)
Figure 2
The graphs show that the income of the upper 5% nearly doubled from 1979 to 2002 with while the growth coefficient increased by slightly more than half.
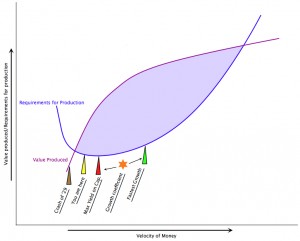
While the CL model is capable of predicting changes in new wealth distribution, it has a far broader capability. In the graphic representation below, the model is used to define an envelope (shaded blue area) in which an economy is capable of growth. Some areas of this envelope are more stable than others. The model clearly shows that there is an optimum growth coefficient for overall growth, and another point for maximum return on capital.
Figure 3
It also shows how the effects of wealth distribution are derived, with the red arrows and green arrows approximating the conditions that produce the red and green wealth distributions in Fig 2.
The upper purple line represents the Value Produced by the economy vs. how fast money is flowing. The faster the flow, the higher the rate of production possible. The blue Requirements for Production curve is derived from the Growth Coefficient and a coefficient representing the total of all costs including capital depreciation required to sustain production.
The growth coefficient, which is largely influenced by government policy, slides along the blue line, increasing to the left and decreasing to the right. At the green arrow, which is where a government would like to see the economy operating, the overall economic growth is fastest, as this is the point at which the difference between the value produced and the requirements is greatest and most stable. If we increase the growth coefficient, sliding it left to the red arrow, the economy will grow at it steepest angle as this point represents the maximum yield on capital and greater risk. This is where the Republican/business interests wish to operate, hoping to maintain a higher yield than their competitors. Note that this point is considerably slower on the velocity of money axis
The model provides a possible answer to Krugman’s question as to how politically induced financial changes can occur rapidly. Under the deregulation of the Bush era and the dramatic rise in the size of the financial sector, regulatory changes in banking laws, energy distribution (which created Enron) and a host of other market segments caused extremely rapid flows of capital away from long term productive investments and into complex and ultimately dangerous financial instruments on Wall Street. A good example of such a legislative/regulatory influence was the Commodity Futures Modernization act of 2000, which forbid regulation of derivatives. This allowed Wall Street to create unlimited new financial products, supposedly of great value but as history shows, all it did was to provide new gaming tables at the financial market casinos.
Warren Buffet characterized these derivatives as “financial weapons of mass destruction…derived by madmen” posing “mega-catastrophic risk’. In spite of Buffett’s warning, the legislated promise of no regulation cause a near instant flight of capital and talent from investments in the productive sector of technology and manufacturing to the glittering excitement of the bond markets. The short-term negative effects of such changes have been all too apparent, but Bartels also documents that the greatest positive differences occurred in the second year of Democratic presidential term, thus showing that it is clearly administration policy that brings about the changes in wealth distribution. In the Obama administration, it has take a year to overcome the job destruction of the Bush White House, and at least the private sector job rate growth is now positive.
Figure 4
The current ideologically based leftward shift of the growth coefficient toward the yellow arrow (Fig 3) and beyond is very worrisome, as the economy can only maintain a stable condition when operating within the blue shaded area on the CL model. At either extreme, the economy will decline. The right hand side of the shaded area represents a socialist worker’s paradise where all of the capital available is invested in wages and benefits, and nothing available to keep the country competitive in the world markets, or even cover depreciation. In general, it appears that the current U.S. political pressure is to move the growth coefficient to the left, while the Scandinavian and many European countries work to keep their economies to the right of the green arrow, where there is comparatively little change in the slope of the ‘requirement for production’ curve and the economy is far more stable and wealth distribution is less concentrated.The far left hand side of the envelope is even more dangerous, as the velocity of cash is reduced and the safety margins over disastrous stall and economic stall and collapse are further diminished. The result is that even a minor upset will shift the growth coefficient so far to the left that it will fall out of the blue envelope shown in the model, and end up at the brown arrow on the curve, or a repeat of the Great Depression. One might well speculate if the reactionary forces are attempting to move the economy back to the condition described in Sir Arthur Lewis growth model wherein there is effectively an unlimited supply of labor as a ‘capitalist’ sector can draw on unlimited labor from a ‘subsistence’ sector, thus being able to add almost unlimited workers without increasing wages and labor costs. Sir Lewis, borne 1915 in Saint Lucia when it was still a British territory, was the first black Nobel Laureate which he was awarded in 1979. Lest you think that Lewis’ growth model applies only in a third-world country, consider the current Mott Apple Juice strike in upstate New York. The company, owned by the DrPepperSnapple Group conglomerate, has dramatically increased its profitability, yet is demanding major wage cuts and pension give-backs with the sole justification to bring its labor costs “in line” with the depressed wages in the area caused by layoffs and plant closings at Xerox and Kodak.
Of significant concern is that the model predicts the existence of a narrow window between the far left of the safe operating envelope and the actual collapse of the economy. Here, it is impossible to restore the economy to sustainable condition by injecting capital, and it is just possible to ‘hold’ the economy in this narrow window by increasing debt and inflation by adding to the money supply and borrowing while running a negative trade/current account without sufficient stimulus to increase productivity. This condition would correspond to ‘stagflation’ effects which can only be broken by sufficiently stimulating production to move the growth coefficient to the right, or the value of the currency shrinking to the point that exports will stimulate a return to sustainable condition.
In 2008, with the collapse of the sub-prime market, the economy fell out of the safe envelope defined by the CL. The Bush White House very briefly flirted with their own free market ideology by allowing Greenspan’s stated need for “creative destruction” to overtake Lehman Brothers, who filed for bankruptcy in September 14, 2008. This effectively moved the growth coefficient to the left, outside the blue zone and towards the brown arrow of depression. (Fig 2)
The economy was effectively stalling. Bush and Paulson et.al. hurled their ideology out the window, bailed out AIG less than 48 hours after they had let Lehman fail, and threw a billions of taxpayer dollars at the banks in an attempt to shift the growth coefficient to into a stable zone. Short term, this was the right thing to do, but the Obama administration missed a golden opportunity to impose conditions on Wall Street that would have significantly shifted the growth coefficient to the right and further safety.
It is an arguable point as to whether the subsequent stimulus was large enough to shift the growth coefficient sufficiently to the right to actually be in the safe zone, and even if it did, there is essentially no margin of safety for future upset, such as further decline in the housing markets, loss of state jobs as workers are laid off to balance State budgets, and a host of other storm clouds on the economic horizon. Yet Wall Street has changed nothing after this near-death experience.
My CL model derives much of its basis from the same laws of physics that govern the behavior of gas molecules which are the same laws that govern flight, so while it is sad to use an airline disaster as an an analogy, it fits all too well.. On February 12, a Continental Connection airliner on approach to Buffalo (on autopilot…the same way Greenspan said derivatives controlled risk) fell out of the sky and crashed, killing all aboard. Flying in bad weather, the airplane had picked up a load of ice on the wings (equivalent of problems in the sub prime market) which caused the speed and performance to decay. The pilot disconnected the autopilot just before a safety device called a “stick shaker” kicked in. At this point, the laws of physics, and the flight manual and the stick shaker were all telling the pilot that he must apply full power, lower the nose, give up some altitude and gain velocity and fly out of the stall condition.
In the stress of the moment, the pilot failed to follow the explicit directions from the flight manual, and added only 75% power (the too small stimulus) and continued to haul back on the stick and pulled the nose up, struggling to maintain altitude. (Wall Street using the stimulus and going back to business as usual; trying to keep their huge profits and paying out giant bonuses) Seconds later, the velocity (same as velocity of cash on the CL graph) decayed to the point that the aircraft literally fell out of the sky.
The economy is in the same situation as when the warning device kicked in. The stick shaker, like Krugman and others who feel further stimulus is necessary, call for more power (stimulus) and lowering the nose. Meanwhile Boehner, McConnell, the more fringe politicians, the deficit hawks and bond vigilantes are refusing to add power because it will add to the deficit. e.g the cash flow resulting from extending unemployment. They’re yelling “Pull up! Pull up!” like the annunciator on an aircraft’s terrain avoidance warning system. In many airliner tragedies, the conflicting messages are the last sounds heard on the “black box” recorder before the final impact.
It’s up to the pilot in command to follow the procedures in the flight manual and recover to a safe condition, regardless of what people are yelling at him. I can only hope that Obama does the right thing and we have sufficient altitude to recover.
John Hulls
2 September 2010, Point Reyes, California
Notes on CL model.
In the 1950’s, FW Preston1 noted the similarity of gas laws to many universal diversity patterns across the sciences, specifically Boltzmann frequency of molecular kinetic energies in gasses, the Pareto frequency distribution of personal incomes and the frequency distribution of personal income in countries and species abundance in ecological communities.
With the widespread availability of individual computational power with the advent of the personal computer, models based on statistical probability distributions exploded and while shown to have real utility, especially in the field of ecology and species distribution, were used with less-than rigorous application of abundance log transformation. In fact, Necola 2007 2 points out that that abundance distributions across a wide variety of systems (e.g., precipitation classes, paper citations, stock volumes, garden seed offerings, concert setlists, word use and US trailer home frequencies, which may or may not display a power law signature, demonstrate non-linear monotonically decreasing probability functions and could be equally or more accurately modeled with exponential or log-series decay.
They also pointed out that while it was unlikely that performances of the band Cowboy Junkies mimic community ecology processes, their setlists displayed rarity-enriched abundance distributions, power-law accumulation curves and non-linear distance decay. However, this does make their point that many of these patterns, which also exist in economics, may well be influenced by processes more fundamental than those proposed by many investigators.
The collapse of my 401K in the recent stock market debacle raised the question as to how it was that the vast majority of economists and banker’s models failed to predict the collapse, triggering this current effort. Stiglitz3 comments at the 2010 INET conference mirrored my concerns about what I found, After further searching, some of the econophysics work looked interesting. The wealth distribution curves produced by Yakovenko et.al (2004)4 bore a remarkable resemblance to pressure and velocity distribution curves over airfoils, with which I have a wide range of practical experience from aircraft to wind turbines and race car aerodynamics, and very personally, as a glider pilot.
The pressure and velocity distributions are produced by the flow of gasses over a surface, and given the ability to produce a surface with velocity distributions that model wealth distributions, I explored further. The reference/weblink5 is a very simple model that shows the effects of shape and angle of attack on pressure distributions, with which the reader can experiment.
Modern airfoil design programs such as the Eppler code enable us to produce an airfoil shape based on a pre-established pressure distribution, from which the code produces the velocity and pressure distributions, boundary layer development, lift, drag and moment coefficients. As we know the various coefficients of the surface, including the control function necessary to resist the pitching moment of the surface, the dynamics of the economy can be investigated. Thus, the shape developed can be ‘flown’ through an atmosphere of transactions, with altitude representing the height to which the economy might grow rather than the ‘gas in a box’ model used in the models referenced earlier.
The boundary layer development on the upper surface is what is most critical to my model, as there are three distinct conditions. By using the shear forces at the boundary layer as the wealth transfer mechanism, the greatest wealth is accumulated where flow is fastest, the rate eventually decaying until the flow separates, and no shear forces are developed, representing no wealth transfer or unemployment. There is a laminar flow region at the leading edge of the airfoil, in which the distribution is similar to a Pareto distribution, and the velocity is highest. As momentum is lost by shear forces against the surface, the boundary layer transitions to a turbulent but attached condition, resembling a Boltzmann distribution, thus replicating Yakovenko’s (ibid) combined Pareto/Boltzmann wealth distribution. However, if the angle of attack is increased excessively, sufficient momentum is lost that the flow separates from the surface.
The curves in Figure 2 were produced using a simplified boundary layer model by producing a cambered surface reflecting wealth distribution in the mid 70’and simply increasing the lift coefficient (equivalent to the growth coefficient in my model) to produce the curves for 1979 and 2002. The fit is quite good, however, the CL model encompasses the entire population, including those who receive government assistance, whereas the CBO figures include only those making tax returns. Also, the program I am using has a somewhat simplified boundary layer development capability, influencing the separation and stall characteristics. Bartel’s analysis would also seem to indicate that there is a change in the camber of the model with changes in administration, (corresponding to camber changing devices such as flaps and slats on airfoils) and preliminary investigations show that this will produce a more representative output.
Economists will recognize that some aspects of Figure 3 share a similarity with the classic Solow growth model. The ‘value produced’ curve bears some relationship to the y=f(k) curve of the Solkow model (y=output/income of worker, k=capital per worker) to the extent that adding capital per worker reaches a point that additional capital invested produces diminished returns. However, in the CL model it is actually the value that can be produced for a given velocity of cash in the economy. All of the other factors in the CL model are dimensionless coefficients, which produce the performance envelope of Figure 3. I am currently evaluating which are the best econometric inputs for these coefficients. e.g., what is the best data for determining the accuracy of predicted changes in wealth distribution, especially at the lower income levels? I suspect that simply matching the CBO tax returns is a simplistic approach as they do not include unemployment and government transfers. Also, growth in the Solow model can decline to zero whereas the CL model will collapse to a lower state if it goes outside the stable envelope.
It is encouraging that the model shows that there are stable ranges for economic growth that span a variety of ideological/political positions but as in ecological populations, exceeding limits can cause decline and collapse. Dynamically stalling the CL model produces a hysteretic collapse to a lower level, much like bubbles bursting in the economy or species populations in ecology. Even in its current form, the model is producing interesting results and I will continue to refine it further, including integrating lower surface pressure into the model, but it will be appreciated that this is a part time endeavor for me. Comments (hopefully constructive) are appreciated.
1. Preston, F.W. 1950. Gas laws and wealth laws. Scientific Monthly, 71, 309-311.
2. Nekola, J.C. & J.H. Brown. 2007. The wealth of species: ecological communities, complex systems and the legacy of Frank Preston. Ecology Letters, 10:188-196.
3. http://ineteconomics.org/blog/joseph-stiglitz-need-new-economic-paradigms
4. A. Christian Silva and Victor M. Yakovenko Temporal evolution of the “thermal” and “superthermal” income classes in the USA during 1983–2001 Europhysics Letters (on line) 31 Oct 2004
5. http://www.desktop.aero/appliedaero/airfoils1/interactiveaf.html

I’m unable deal with your terminologies & therefore fully follow u but it’s obvious things are badly out of whack & human decisions & greed combined with a shortage of common sense and/or real brain power as evidenced by Bush/Cheney years & others are largely responsible.Was the Coom. Mod act passed in 2000 while Clinton was Pres.?
Your are right about the Commodities act. Further bolstering the comment that Clinton was the best Republican that we ever had. At least, everyone made out better under his administration.
John, I think that you will find this article interesting. If so I’d appreciate your comments.
Thanks!
http://www.sccs.swarthmore.edu/users/05/qian/OLD/JenSciencePolicy.pdf
Interestingly enough, almost all of these successful speakers authored best-selling books to support their messages.
There are a lot of things to consider when planning your seminar.
Whilst the public speaker may be funny, entertaining and forthright, there tale
is probably not one that will be relevant in the
workplace.
Adsense is actually a really great program for those who maintain blogs, as blogs get updated all the time and the Adsense possibilities are almost limitless.
The website speed test at Secret Search Engine Labs will
analyze how fast a page on your site is loading and give you tips on how to
improve it. What Googlebot is looking to see in the
Free Local Google Advertising Listings is quite another.
Unspecialized Facts Back this output aca healthcare reform
General Tidings Upon this product symptoms of an std in men
Global Message Here this outcome after a heat stroke
Revolutional update of SEO/SMM package “XRumer 16.0 + XEvil”:
captcha breaking of Google, Facebook, Bing, Hotmail, SolveMedia, Yandex,
and more than 8400 another size-types of captchas,
with highest precision (80..100%) and highest speed (100 img per second).
You can connect XEvil 3.0 to all most popular SEO/SMM programms: XRumer, GSA SER, ZennoPoster, Srapebox, Senuke, and more than 100 of other software.
Interested? There are a lot of introducing videos about XEvil in YouTube.
Good luck 😉
Revolutional update of SEO/SMM package “XRumer 16.0 + XEvil”:
captchas regignizing of Google, Facebook, Bing, Hotmail, SolveMedia, Yandex,
and more than 8400 another types of captchas,
with highest precision (80..100%) and highest speed (100 img per second).
You can connect XEvil 3.0 to all most popular SEO/SMM software: XRumer, GSA SER, ZennoPoster, Srapebox, Senuke, and more than 100 of other programms.
Interested? There are a lot of impessive videos about XEvil in YouTube.
See you later!
специалист по залогам вакансии пермь
статья 35 гражданского процессуального кодекса рф
Delete this!
Удали это!