Capital Sin: Part 1

by John on July 6, 2014

 Greed and Its Economic Effects:  An Analog Simulation

Can we determine the economic impact of greed? The lasting contribution of Piketty’s masterful book, Capital in the 21st Century, may well be his work and that of his colleagues in the compilation of a meaningful body of international data on inequality such that it can be discussed against a factual background, rather than the theology of free market evangelism and its tenets of faith, such as ‘trickle down economics’ and the supposed self-interested wisdom of ‘homo economicus’. For example, take his World’s Top Income Database and his papers, with Emmanuel Saez of U.C. Berkeley, on optimum taxation, guaranteed to upset the 1%.  The database proved invaluable in developing a very basic analog economic simulation capable of delivering income distributions from defined economic conditions, used in this essay to examine greed vs. enlightened self-interest and the impact on economic performance.

The basic necessities for such a study are two-fold.  First, is there a workable general definition of greed that lends itself to modeling, and, second, can we find a sufficiently robust analog to enable us to conduct experiments? As Reiss points out in his 2011 paper comparing simulations to mathematical models, a simulation enables us to examine complex situations without many of the constraints and assumptions necessary to render an analysis mathematically tractable. He gives the wind tunnel as an example, where it is not necessary to mathematically define the precise conditions of the flow field over a surface to conduct useful experiments that can be used to analyze the real-world performance of a wing.

Equally important, as Phillips accomplished with his famed Moniac hydromechanical analog simulator of the ’50s, a physical analog can makes ‘visible’ the model’s functioning and output.  Here, we show that one can model greed with a physical analog simulation capable of producing income distributions.  As Reiss discusses, such simulations enable us to examine the basis of many fundamental assumptions in a way not possible with strictly mathematical models.  In this case we examine the relationship of greed, enlightened self-interest and income distribution to over-all economic performance, and generate an illuminating comparison of U.S. and Swedish income distribution from 1979- 2007.

How can we define greed in terms of economic performance? Amartya Sen, in considering the enhancement of individual capabilities as the correct path for economic development, states that “Human beings are the  agents, beneficiaries and adjudicators of progress, but they also happen to be – directly or indirectly – the primary means of all production.” Sen argues for a society that gives the individual the freedom and means to realize their capabilities. In other words such a society, by increasing the value of its human capital, will make the most progress. Thus, in general terms, if greed detracts from the development of a society’s human capital by restricting the beneficiaries of progress to a limited portion of society, it will have a negative effect on economic performance.

Here, we say that greed exists when the value extracted from the means of production by a faction in society is such that it compromises the society’s over-all growth rate to the extent that the actual income said faction would have received is less than they would have received had they truly maximized self-interest. This effect is best shown by this graph from Bartels 2008 Unequal Democracy, comparing growth of income under Democratic and Republican presidents from 1948-2005. It shows that the Democrats tendency to support more egalitarian policies translates into greater real income across all strata of society and thus provides more opportunities for a broad spectrum of the population to achieve its capabilities and thus delivers greater economic growth. Note that the lower percentiles actually do better than the upper percentiles under Democratic administrations, who, in turn do better than the upper percentiles under Republican administrations.

To examine this effect, we us a physical analog simulator, the Cambiant model, inspired by Phillips. His Moniac used the physical analog of interconnected tanks and valves to model stocks and flows in an economy, which Krugman comments on as ‘hydraulic Keynesianism’. He is also a big fan of Bartels, whose graph is reproduced above. However, while Phillips Moniac was successful, by its very nature , the ability to model inertia, friction and turbulence exceeded its capabilities The Cambiant model is a “fluid dynamics Keynesianism” analog simulation using transactional flow over a defined surface that represents the actual structure of an economy. Going beyond the interconnected tanks, valves and graphs of Phillips, the analog used in the simulation has long- and short-term cyclic behaviors, variable damping characteristics, inertial properties and friction and also has a ‘stall’ or collapse regime that simulates a Minsky moment, such as the crash of the sub-prime market and–more importantly in addressing the question of greed—produces a structure of the economy that, amongst other outputs, produces income distribution for a given economic structure under specific operating conditions and control inputs.

It also produces a trajectory for the economy and can be run, to borrow an aeronautical metaphor, as a real-time P-I-L simulation (Pilot/politician/policy maker/pundit-In-the Loop)showing the effects of control inputs, including those that can cause an economy to either maximize economic performance, recover from an upset, or go out of control.  The results are informative: it is possible to ‘stall’ and crash the model. It also shows how easy it is to get into a PIO (dare one say Politically Induced Oscillation) with an out-of-phase fiscal input. This was a circumstance that greatly concerned Phillips regarding stability, as discussed in in his 1954 paper, ‘Stabilization Policy in a Closed Economy’, and subsequent work on the subject for which he borrowed time on an early analog computer used for evaluating aircraft stability.

It is beyond the scope of this highly speculative essay to describe the simulation fully, which in its current stage of development, providing more of a cartoon representation of the economy than a fully quantifiable output, so we will look at a couple of essential elements. The shape of the surface (the structure of the economy), effectively a lifting surface or ‘wing,’ produces growth and cost-of-production coefficients that vary with the flow over the surface, responding to both control inputs and exogenous events. The coefficients are defined by the shape of the surface and also vary proportionately to the velocity of transactions. The growth-coefficient curve slopes upward linearly until it rolls over and stalls. The cost-of-production coefficient is an upward sloping curve, concave to the growth curve. By studying the ratios of the values of the two curves, a polar curve of economic performance can be produced by the analog surface under varying conditions.

From this curve we can identify not only the growth coefficient that produces the highest rate of growth but also the point that produces the steepest angle of growth, albeit at a lower rate of growth, and the point at which the economy will stall. At the point of highest growth rate, the structure of the economy will be operating to the maximum benefit of the over-all population, and any change from that point will make someone worse off. In other words, the point of optimum growth coefficient and resultant income distribution reveals the Pareto Efficient point of functioning of a given economic structure.  However, as we move towards higher growth coefficients beyond optimum, we get an ever-increasing income inequality, approaching the stalling point of the economy, resulting in a significant drop in performance. In the most basic terms, excessive income inequality ends up harming the apparent beneficiaries of the distorted revenue stream, whether they are aware of it or not.

As shown by Bartels, enlightened self-interest should lead the rational ‘homo economicus’ to influence the economy to operate at the point of maximum growth. The simulation shows that this point also produces significant inequality but nothing like current circumstances, which show the economy at close to the maximum angle of growth and well into the region of incipient stall. Therefore, we can define the degree of greed as to how far one is willing to influence the economy to operate ever closer to the point of stall. Even with the ‘rip-your-face-off’ level of greed evident in Wall Street and the sub-prime debacle well into the stalled condition, it is possible for the 1% to be doing very well, relative to everyone else, while the overall economy is sinking like a rock with economic devastation of the lower percentiles of the economy.  At any point to the left of the optimum growth coefficient represents increasing degree of greed at the expense of the entire economy or, as John Stuart Mill put it, “Men not only desire to be rich, but richer than other men.” The means by which the analog represents extraction of income is the shear forces in the boundary layer of the transactional flow, and if those at the leading edge of the economy extract too much momentum, the flow will begin to detach at the the lower earning segments of the economy at the trailing edge, the separation point moving slowly forward, through the middle class until eventually the economy stalls. Simply put, if those at the leading edge of the economy extract more than they generate in productivity, economic performance will suffer.

We can see the effects of the increasing greed on the U.S. economy by comparing its income distribution with Sweden, based on the general assumption that the characteristics of the surface model of an OECD-type economy are reasonably similar. The Cambiant simulator was used to develop income distribution for the U.S. and Sweden. The resulting output was checked against Congressional Budget Office data, and similar data for Sweden. The effects of the Swedish banking crisis of 91-92 are clearly visible, as is the U.S. response to the Volker interventions, which introduced a pronounced, but heavily damped oscillation that subsequently settled down.  The dot.com bust and the subsequent crash of 2008, both of which occurred in a condition where the simulation showed that the level of stability of the economy had been significantly reduced. The optimum growth coefficient is at a model value that occurred in Sweden about 2002-3.  The instability in the U.S. economy is evident as the growth coefficient is increased, and the Swedish economy achieved substantially higher GDP growth for the same period.

In both the dot-com crash and the approach to the crash of 2008, the simulation shows that the upper U.S. percentiles were extremely greedy. The economy not only operated well beyond the optimum growth point but actually exceeded the maximum growth coefficient.  Still attempting to maintain an unsustainable growth rate and level of inequality, it progressed well into a semi-stalled condition in which the economy lost considerable assets. The cost-of-production coefficient also grew dramatically, showing that the increased earnings extracted by upper percentiles were not justified by any similar increase in the efficiency of allocation of capital held predominantly by a top fraction of the top 1%, exactly fitting this essay’s definition of greed.  ( It should be noted that the simulation also displays the the force coefficients on the model, as well as the level of stability, as will be discussed in Part II)

In the spirit of the saying that “It is better to be roughly right than precisely wrong” (from Carveth Read, often mis-attributed to Keynes), the Cambiant model does not rely on the mythical rational agent and clearing markets, etc. Instead it uses its analog integration to show the state of the struggle for control between truly enlightened self-interest and outright greed as to how the economy will be operated. The result of this struggle determines the growth coefficient of the economy and thus its income distribution and trajectory. With all the discussion of Piketty, inequity and his return to a Gilded-age distribution of wealth, the simulation shows that this state is not an equilibrium condition and is increasingly unstable and prone to shocks. This is historically evident in an analysis of the rise and fall of preceding financial empires in Economics: Repeating Rhymes from this blog.

Which brings us back to Sen. In a technological society, encouraging people to achieve their maximum capabilities, thus increasing the value of the human capital in that society is essential to a healthy, competitive economy. One has only to consider the fall of the Spanish empire to see the results of failing to invest in human and technological capital and surrendering instead to the siren song of speculation and financial instruments. Writing in 1600, Gonzalo de Cellorigo, observed, “an extreme concentration of rich and poor and there is no means of adjusting them one to another. Our condition is one in which we have rich who loll at ease, or poor who beg and we lack people of the middling sort, whom neither wealth or poverty prevents from pursuing the rightful form of business enjoined by natural law.”  Holland and England followed the same path and the US escaped only because Roosevelt was a ‘traitor to his class,’ further aided by the economic stimulus from the human disaster of WWII. Now, yet again, we are poised on the brink, in more ways than one.

It seems that, especially after Piketty’s ‘Capital’, everyone is making Churchillian pronouncements about our economic future. Why should amateurs from the ‘pond-water’ school of economics (as opposed to the citadels of freshwater and saltwater economics) forgo making predictions, provided they are at least logical? Specifically, Sweden has a housing bubble and seems to be entering a degree of inequality where the model shows that the stability of the economy is greatly reduced and economic forces required to produce dramatic changes are very low. Thus, on a larger scale: This time things may well be different, given the interconnected nature of the global economy, which is about to be stressed, shaken up and rearranged by global warming (the scientists are right) in ways beyond comprehension. Will we fatally squander our resources in protecting the wealth of the oligarchs, as the sea laps at their hyper-expensive, gated and guarded real-estate in London, New York and elsewhere? Or will we collectively move beyond the struggle to Churchill’s “broad sunlit uplands”? The beaches may already be lost, and it will take our best use of human capital to prevail.

Part 2 will show more detailed output of the model for the US and Sweden with the values produced by the force coefficients, plotted against GDP.  These  show that, starting in the early 80’s virtually all of the increase in productivity has been to the benefit of the leading edge of the economy, with no resultant increase in rate of economic growth.  It will also discuss whether economic forces are the main driving forces, or if, as Bartels claims, the current inequalities are ” not simply the result of economic forces, but the product of broad-reaching policy choices in a political system dominated by partisan ideologies and the interests of the wealthy.”  

1 comment

Cloudy, with a Chance of Default

by John on January 2, 2013

 Timely forecasts can be essential to safety

Global finance has more in common with weather prediction than many economists might admit. If they studied the history of weather forecasting, they might be a little humbler in their statements about business cycles and equilibrium.

After all, until the ’60s, weather forecasters thought that more data, more computational power and better models would improve long-range forecasting so that a thankful public could plan weddings and picnics far in advance, free from meteorological harm.

Then MIT mathematician and meteorologist Edward Lorenz ruined everything when he noted that his models, run from the same starting point, would produce widely divergent results. Probing the underlying mathematics, Lorenz discovered Chaos Theory, one of the most important scientific developments of our time.

Until then, meteorology had progressed rapidly, based on understanding physical systems. Descartes founded modern meteorology with his 1637 publication of ‘Les Meteores’ but lacked the basic data to develop his theory. As measurements and understanding evolved—Galileo and his thermometer, his student Toricelli with the barometer—and the realization that temperature and pressure varied with altitude, more attempts were made at forecasting, with little success.

Modern meteorology awaited early-20th century developments and the fundamental observation by Norwegian mathematician Vilhelm Bjerkness, who defined the properties of air masses, weather fronts and atmospheric waves. He stated that all future weather patterns stem from their initial form, acted upon by physics via known mechanical and thermal laws. If only the financial ‘weather’ parameters were so well defined.

Meteorologists then felt that they simply needed to feed sufficient data into the correct models. They could not do so until, in April 1950, John von Neumann, of physics and game-theory fame, worked with meteorologist Jules Charney, created the first successful computerized weather prediction. Soon the computerized models were more accurate than their human counterparts.

Despite these advantages, the ability to predict the weather precisely more than a week or so ahead has not happened. Meteorology has made great strides in understanding the weather, such as storm tracks for hurricanes, and overall understanding of drought, extreme weather and climate-change patterns. But, as Lorenz’ discovery shows, the ability to predict weather at a specific location more than a week or so ahead is barred by the chaos intrinsic to global weather. Why should the even more complex, dynamic and non-linear world financial system, mainly governed by human perceptions rather than physical laws, be any less chaotic?

Comparing the development of meteorology and climate science with economics, weather researchers began to recognize that, as the American Institute of Physics put it: “Before they could understand how climates change, scientists would have to understand the basic principles for how any complicated system can change. Early studies, using highly simplified models, could see nothing but simple and predictable behavior, either stable or cyclical. But in the 1950s, work with slightly more complex physical and computer models hinted that even quite simple systems could lurch in unexpected ways. During the 1960s, computer experts working on weather prediction realized that such surprises were common in systems with realistic feedbacks.”

Attempts to reduce climate physics to a couple of hundred lines of equations were set aside in the development of ever more sophisticated simulations, analyzed and modified against their ability to reproduce historic weather conditions, such as ice ages and aerosols from volcanoes such as the 1991 Mt. Pinatubo eruption. Only after decades of modeling of global warming, international cooperation across a wide variety of disciplines including oceanographers and paleobiologists, and numerous model changes to incorporate an increasing range of factors such as aerosols and ocean temperatures, could the editor of Science Magazine announce, in 2001: “Consensus as strong as the one that has developed around this topic is rare in the history of science.”

AWH Phillips, of Phillips Curve and Moniac hydromechanical simulator fame, proposed that a similar effort might be made in the study of economics. Realize that he had done much pioneering work on analog simulators and economic stability in the 50’s when the results were shown on an oscilloscope!

Phillips proposed that future developments might enable the construction of an electronic analog machine that “using a combination of econometric and trial-and-error methods, the system of relationships, the form of time lags and values of parameters of the analog might be adjusted to produce as good a ‘fit’ as possible to historical time series, and the resulting system used in making economic forecasts and formulating policies.  This would be a very ambitious project. Apart from the engineering problems involved, requiring close coordination of statistical, theoretical and historical studies in economics…” The engineering problems have been overcome with the development of massive computational capability, and the history of climate modeling provides a direct parallel in the study of global warming, an even larger problem than economic stability. 

In 2008, Queen Elizabeth, visiting the London School of Economics, asked: “Why didn’t economists forecast the crash?” Consider global finance as a separate entity, assigning resources worldwide; the ‘weather system’ in which economies operate, a chaotic global flow of cash with series of highs and lows, rapidly shifting storms and calm areas.

To borrow from Lorenz’ analogy as to the flapping of a butterfly wing setting off a tornado in Texas, the waving of financial paper by a London or Singapore trader can trigger the loss of billions of dollars in New York. Recall the ‘London Whale’ and JP Morgan, and the collapse of Baring’s Bank (1762-1995) by rogue trader Nick Leeson. He hoped to cover his errors by betting on a major rise of the Japanese Nikkei stock index, only to see it sent crashing by the 1995 Kobe earthquake. The delusion of human expectations met the realities of real-world events.

Back in the ’30s, John Maynard Keynes spoke eloquently on the unpredictability of such events and their financial impact: “About these matters there is no scientific basis on which to form any calculable probability whatever. We simply do not know.” More recently, Nassim Talib used the analogy of the Black Swan to explain the unpredictability of events in his eponymous book.

Consider Talib’s Mediocristan/Extremistan country analogy, replacing geography with an economic weather map where financial markets’ ‘ extreme weather’ can radically affect real-world economics. Visualize the ‘real’ economy as an aircraft flying through the ‘atmosphere’ of the financial markets. We want a smooth ride through the stable areas on our financial weather map. But the risk of encountering extreme turbulence, such as an embedded thunderstorm, is greatly increased when flying in unstable weather.

Airlines operate in all sorts of weather but avoid extremes by using weather radar and other short-term measurements to assess the risk of continuing the flight and divert around those extremes. If the weather is too severe en route, they don’t fly. Even today, their judgment may be flawed, evidenced by the 2009 Airbus crash in the South Atlantic, but airline flying has become extraordinarily safe.

The Federal Aviation Pilots Handbook guidelines on extreme weather could easily be changed into a policymakers ‘flight’ manual to insure safety. In extreme weather, the most important task is to maintain a stable attitude, rather than altitude and maximum velocity, and operate at a speed that prevents overstressing the aircraft’s structure, thus avoiding situations that could exceed its safe loads and stability envelope. Flying at maximum speed and altitude into potential extreme turbulence is the economic equivalent of turning control over to an autopilot programmed by the financial community, oblivious to the risk of flying directly into financial turbulence capable of ripping the wings off the economy.

Dr. David Leinweber of the Advanced Computational Group at Lawrence Berkeley National Laboratory has proposed just such a solution to the problems of instability in flash trading: upon  detection of instability, slow the rate of automated trading until markets enter a more stable regime, as discussed in his OECD article ‘What can NASCAR teach NASDAQ about avoiding crashes?’.  He proposes real-time monitoring of trading conditions, much as weather forecasters monitor physical data, and rapidly identifying conditions that will lead to instability, then slowing the markets to prevent these conditions from getting out of hand, as in the famous ‘Flash Crash’ and more recent high-speed trading debacles.

It’s tempting to make analogies to Hurricane Sandy, where it was impossible to predict the exact birth of the storm. Once it developed, short-term predictions of its path and impact became possible. The phenomenon of ‘gravity waves’ is perhaps a far better analogy for the interactions of financial markets with the real world economy.  They can rapidly induce severe weather events, such as 4.5-inch-diameter hail in Texas, as illustrated in this NOAA article, (be sure to watch the animation).

Weatherwise, a highly readable meteorological journal  carried a fine explanatory article describing snowfalls, where weather/ocean interactions over the Pacific and Arctic can trigger fast-moving conditions on the East Coast that shut down virtually everything. These snowstorms incur real and immediate economic impact, including the costs of snow removal. Similarly, a financial ‘gravity wave’ such as the sub-prime debacle can cause a storm that dumps enough on the real- world economy to bring it to a near halt.

Perhaps economists should revisit William Phillips’ work on cybernetics and stability as a basis for studying the interactions of financial turbulence with the real-world economy. We could then give government agencies the computational and data-gathering tools they need to monitor Wall Street and the financial community in real time, so that they straighten up and fly right.

Till then, the forecast will be cloudy, with a chance of default.


5 comments

Our Children Know

December 18, 2012

 2011 Advertisement for the Bushmaster ACR taken from the web.  (Click for larger image) The ad heading, “Forces of Opposition, Bow Down” is designed to evoke strong emotions and convey the power to control.  Considering the unspeakable events in Connecticut, it gives perspective to look at the ad above vs. websites about the Bushmaster ACR that […]

Read the full article →

The eleventh hour of the eleventh day of the eleventh month.

November 13, 2012

I was born in England after WWII, and I still remember the paper red poppies, sold as the remembrance of Armistice Day, celebrated by Veterans Day in the U.S.   I wrote this piece several years ago, and somehow, on this most recent Veterans Day, the realities of war seemed lost in the force of […]

Read the full article →

Is the Financial Sector Worth What We Pay It?

October 19, 2012

Plenty more where that came from! (This article is cross posted from my article for OECD Insights where they provide discussion of a wide range of subjects that influence world development) A basic capitalist tenet is that the market represents the most efficient way to allocate capital. How well is it working? We are rapidly evolving a fast-moving, […]

Read the full article →

Downton Abbey Economics

October 14, 2012

Celebrating the Height of Empire as Queen Victoria Opens the Great Exhibition of 1851 How much do Public Broadcast Service viewers understand about the economy that led to the lifestyle of the wealthy Edwardian-era family in the hit series Downton Abbey? If one watched only PBS historical dramas, the British history leading up to the […]

Read the full article →

Napoleon III, Butter and West Marin

September 14, 2012

Large cheese waiting for shipment on the platform at Fallon, West Marin in the late 1800’s Napoleon III had a huge effect on agriculture, product branding, lobbying and indeed, on the health of West Marin’s dairies. In 1869 he offered a prize for developing a butter substitute for his army, while appeasing the lower classes […]

Read the full article →

Polluted, Political, Pregnant or Profitable

August 22, 2012

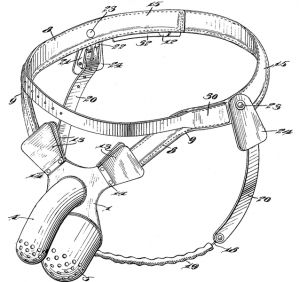
Male Chastity Belt, US Patent No.995600 by Jonas E. Heyser, 1911.  Ideal for preventing platform self-abuse and hypocritical behavior in the more risque quarters of Miami during the upcoming Republican Convention Occasionally scientific fact, polemical positions and public policy collide where none of the principal parties look good. Recall the lack of self-awareness of Jonathan Swift’s […]

Read the full article →

Republicans are Planning to Cook Your Grandchildren

June 11, 2012

“How much can the economy really heat up?” NASA Virtual Solar Observatory Image Yet another part of the long-term Republican plan has emerged with North Carolina banning excessive sea level rise . Wondered about the proliferation of super yachts? Obviously the mega-rich who prefer coastal living have made their coasts personal and portable.  No more unseemly […]

Read the full article →

Hedging the Apocalypse

May 24, 2012

When some latter-day Aristophanes distills the tragicomic story from the mash of the current Greek econodrama, I’ll wager that it will have much in common with the original story of the Acharnians.  The London Review of Books synopsized the story in a review of a fairly recent translation, which as they note, had come just […]

Read the full article →